How to Read Football Player Stats: xG, xA, Progressive Actions and More
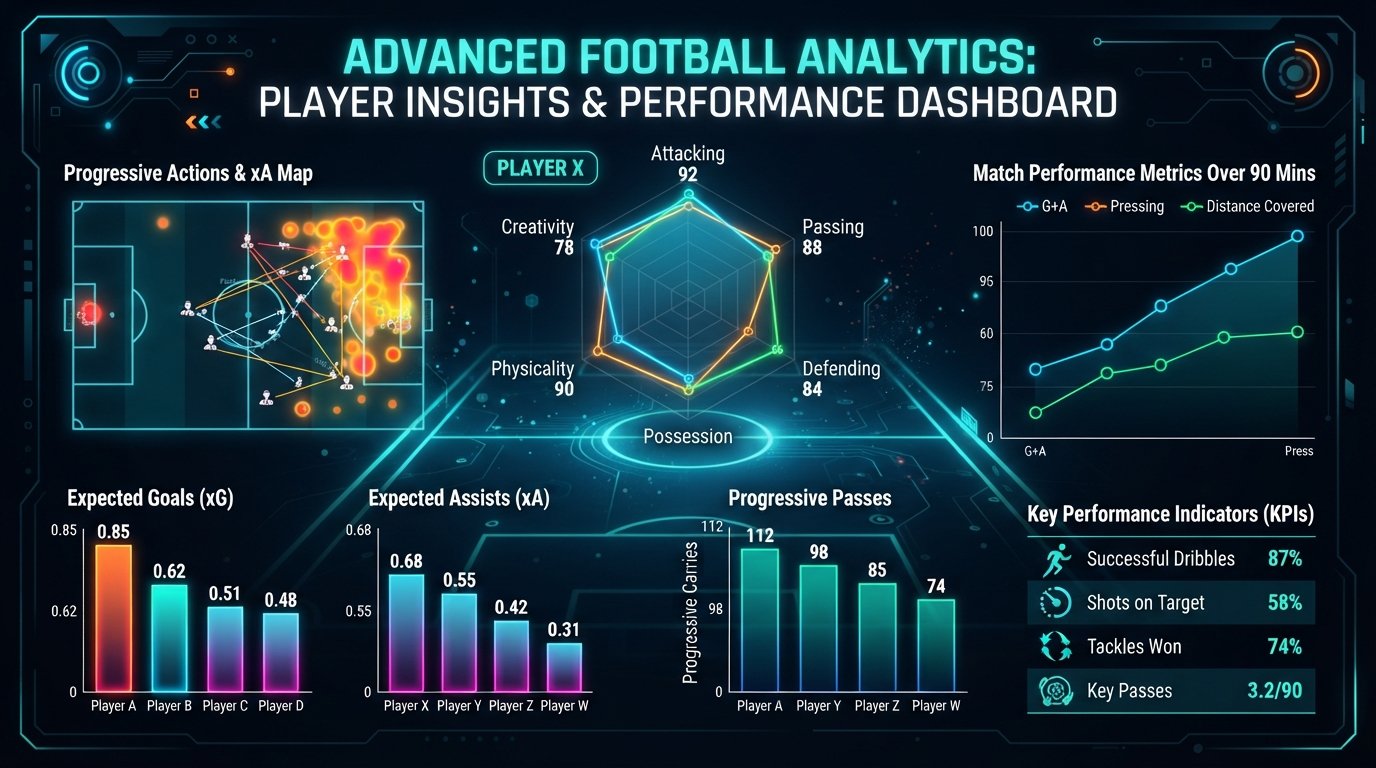
Football statistics are most useful when they answer a football question rather than decorate a player profile. Did a forward create good chances or simply finish an unusually small number of shots? Did a midfielder move the ball toward danger, or just complete safe passes? Did a defender win possession because of individual skill, or because his team defended deep for long periods? Modern metrics such as expected goals (xG), expected assists (xA) and progressive actions help, but only when they are read with minutes, role, team style and match context.
This guide offers a practical method for reading a player data table. It uses published definitions from Opta’s football-statistics glossary, while also reflecting a basic analyst’s discipline: define the metric, check the denominator, compare like with like and then watch the actions that produced the number.
Start with the question, not the leaderboard
Before comparing two players, write down what you want to know. A question about finishing calls for goals, shots, non-penalty goals and xG. A question about chance creation calls for xA, key passes, shot-creating actions and final-third passes.
A question about ball progression calls for progressive passes, progressive carries and sometimes carries that end in a shot. A question about defensive contribution needs pressures, tackles, interceptions, recoveries and the player’s defensive location.
This prevents a common error: treating every number as a universal rating. A centre-forward may have few progressive passes because his job is to pin centre-backs and finish moves. A deep midfielder may have modest xG but still control the match through circulation and progression.
The metric should match the role being evaluated.
What xG actually measures
Expected goals assigns each shot a probability between 0 and 1. An xG value of 0.20 means that, across a large set of comparable shots, roughly two in ten would be expected to become goals; it does not mean that this particular shot was “20 percent of a goal.
” The definition and the probability interpretation are set out clearly in Hudl StatsBomb’s xG documentation. Because providers use different data and model features, a player’s xG from one website may not exactly match another provider’s figure. Comparisons are safest inside the same data set.
For player analysis, compare goals with xG. Goals far above xG may indicate excellent finishing, shot selection or a temporary run of conversion. Goals below xG may indicate poor finishing, difficult execution or ordinary variance.
Neither conclusion is secure after five shots. A larger sample of minutes and shots gives the comparison more weight.
Also separate penalty xG from open-play xG when possible. Penalties are high-value, repeatable events, so a penalty taker can lead a scoring chart without producing the same open-play threat as another forward. Non-penalty xG is often the fairer starting point for comparing open-play attackers.
xA reveals the quality of a player’s service
Expected assists estimates the probability that a completed pass will become an assist. It evaluates the chance created by the pass, not whether the eventual shooter finishes it. The Opta definition considers details such as pass type, endpoint and length; see Progressive actions measure territory gained Progression asks how a player advances the ball toward the opponent’s goal. Definitions vary by provider, so always open the glossary before comparing numbers. In Opta’s published terminology, a progressive pass is a completed pass in the attacking two-thirds that moves the ball at least 25 percent closer to goal. A progressive carry moves the ball more than five metres upfield. Those definitions appear in Opta’s football stats reference. Progressive passes reward a player who breaks lines or moves a possession into a more dangerous zone. Progressive carries capture a different skill: escaping pressure, carrying through space or attracting an opponent before releasing the ball. Neither number says whether the next decision was good. A midfielder can rack up progression by forcing risky passes, while a full-back can post a high total because his team repeatedly builds down one side. Use the split to identify style. High progressive passes with few progressive carries may describe a distributor who advances the ball early. High progressive carries with fewer progressive passes may describe a ball carrier who drives through midfield. Look at progressive actions per 90, completion or retention after the action, and whether the action ends in a chance or a possession loss. Raw totals favour players who start every match. Per-90 rates divide an action by minutes played and scale it to a 90-minute match. The logic is not cosmetic: Read the supporting metrics as a chain A useful profile connects events rather than adding unrelated numbers. For a forward, inspect touches in the penalty area, shots per 90, non-penalty xG, xG per shot and xA. High shots with low xG per shot can mean volume from poor locations. High xG with low touches may describe a specialist who makes valuable runs and receives limited but dangerous service. For a midfielder, combine progressive passes and carries with passes received between the lines, turnovers, pressures and chance creation. For a defender, pair tackles and interceptions with blocks, clearances, aerial-duel outcomes, progressive passing and the team’s defensive height. A high tackle total is not automatically excellence; it can reflect exposure after teammates lose the ball. Shot-creating actions are another useful bridge between creation and the final pass. They count actions in the attacking sequence leading to a shot, so they can credit the pass before the assist or the dribble that opens the channel. They are best used alongside xA because volume of involvement and quality of the final chance answer different questions. FIFA describes football data as a way to understand performance and support better decisions, but data collection standards and event definitions still matter; its football-data resource provides useful context. The most trustworthy evaluation therefore combines transparent definitions, an adequate sample, role-aware comparisons and direct observation. Start by recording minutes, position, team and competition. Next, read the player’s totals, then convert key events to per-90 rates. Compare goals with non-penalty xG, assists with xA, and progressive actions with possession and role. Mark unusual gaps for further investigation. Finally, watch several full-match sequences: one in possession, one without the ball and one in transition. The aim is not to find one magic number. xG describes shot quality, xA describes the quality of completed service, progressive actions describe movement toward goal, and supporting metrics explain how those outcomes were produced. Read together, they turn a stat sheet from a list of totals into a reasoned account of a footballer’s contribution. My name is Jeferson, a passionate football enthusiast and the creator of this portal dedicated to fans of the world’s most popular sport. My goal is to provide reliable information, up-to-date news, match analysis, transfer updates, tournament coverage, and everything happening both on and off the pitch.Normalize the numbers with minutes and possessions
Five checks that prevent misleading conclusions
A practical reading routine
Sources and further reading