Expected Goals (xG) Explained: How Football Analytics Measures Chance Quality
Football results are decided by goals, but goals are a noisy record of what happened. A deflection, an outstanding save, or a striker’s slightly mistimed finish can change a scoreline without changing the quality of the chances created. Expected goals (xG) gives analysts a way to separate opportunity from outcome.
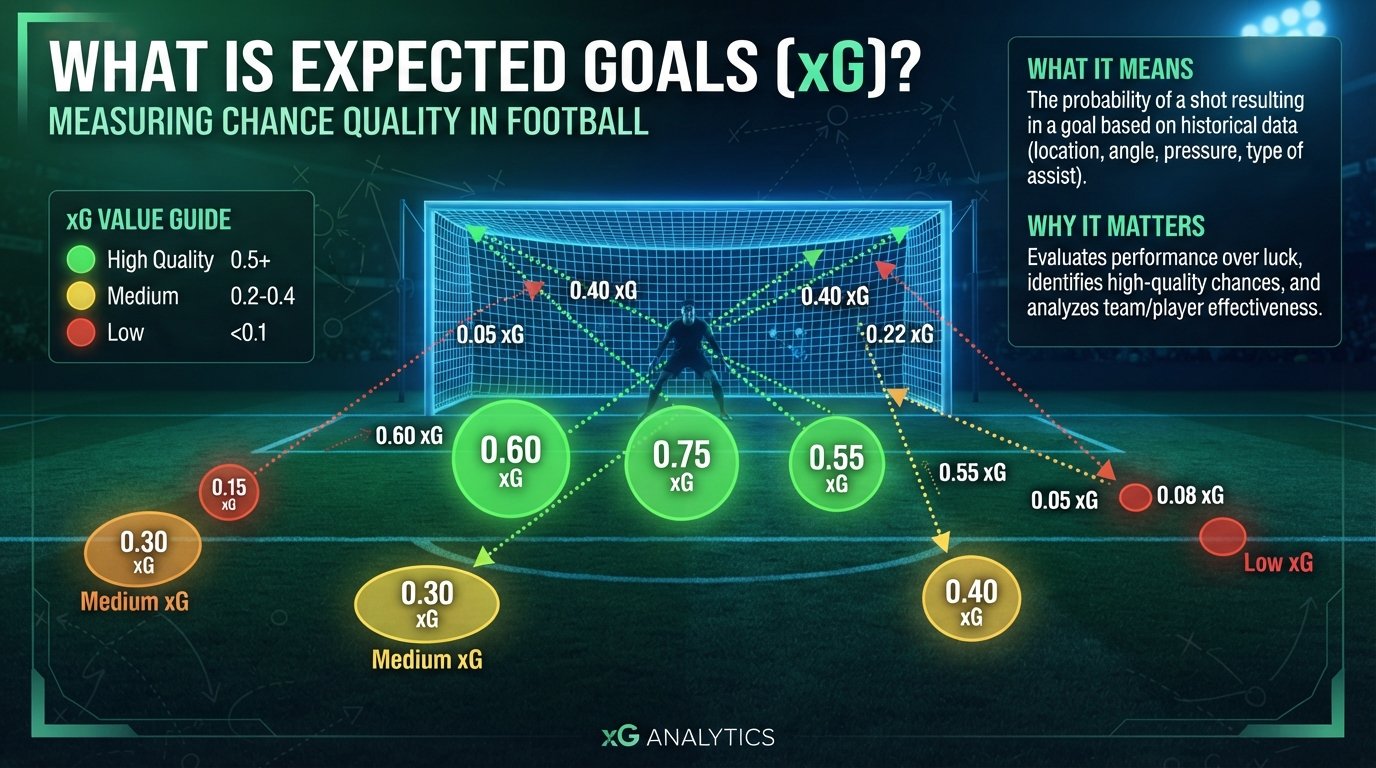
It estimates how likely each shot was to become a goal, then adds those probabilities to describe the quality of a team’s or player’s chances.
xG is not a prediction that a particular shot must go in. It is a probability based on comparable historical attempts. Used carefully, it helps explain whether a side created promising openings, relied on low-value efforts, or happened to finish an unusual match on the right side of variance.
The metric is most useful alongside video, tactical context, and a clear understanding of the model that produced it.
What xG actually measures
At shot level, xG is a number between 0 and 1. A shot valued at 0.10 has an estimated 10% chance of being scored by the model’s reference population.
Repeating an identical situation many times would produce roughly one goal for every ten attempts over the long run, although no individual attempt is obliged to follow that average. An xG value of 0.50 therefore does not mean that half a goal was scored; it means the chance was converted about half the time by comparable shots in the data.
This is why xG is different from a shot count. Ten long-range efforts can represent less attacking danger than two close-range chances after cutbacks. A team’s match xG is usually calculated by summing the xG values of its shots.
If five shots are worth 0.04, 0.08, 0.
18, 0.30, and 0.20, the total is 0.
80 xG. The sum describes the expected goal value of the chance portfolio, not a guaranteed final score.
The public explanations from Hudl StatsBomb, Opta Analyst, and How an xG model measures chance quality An xG model is trained on a large archive of shots whose outcomes are known. Statistical or machine-learning methods identify relationships between a shot’s features and the probability that it becomes a goal. The research literature describes approaches including logistic regression, tree-based models, gradient boosting, and neural networks; the choice of method and the available data influence the final estimate. A 2023 Practical example: why shot quantity can mislead Consider a hypothetical match. Team North takes 15 shots, but 10 come from outside the penalty area and the team’s total is 0.72 xG. Team South takes only eight shots, including two unmarked efforts from the centre of the box, for 1.64 xG. If North wins 2–1, the scoreline records the result, while the xG profile shows that South created the more valuable opportunities. Neither conclusion cancels the other: North was more efficient on the day, but South produced the stronger chance set. Now imagine a different match in which both teams finish with 1.50 xG. One side created fifteen chances worth 0. 10 each; the other created three chances worth 0.50 each. The totals are identical, yet the attacking plans were not. The first team generated volume and may have attacked second balls or shot from several zones. The second found high-value situations but had fewer attempts. Looking at the shot map, xG per shot, assist type, and match video gives a more useful diagnosis than the headline total alone. Penalties offer another practical lesson. Because they are taken from a standard location with broadly consistent conditions, many models assign them a value around 0.75 to 0. 80 xG. A penalty should therefore not be treated as evidence that a team repeatedly created open-play chances of the same quality. Analysts often report totals with and without penalties when comparing attacking processes. For team analysis, start with xG for and xG against (often written xGA). The difference, sometimes called xG difference, summarizes the balance of chance quality. A team that regularly creates 1. 8 xG and concedes 0.9 xGA is controlling the quality battle even if a short run of poor finishing produces ordinary results. Over a larger sample, that underlying profile is generally more informative than one dramatic scoreline. Break the numbers into open play, set pieces, penalties, transitions, and attacking locations. A high total built mostly from penalties has a different tactical meaning from a high total generated through repeated cutbacks. Likewise, a low xGA can arise from disciplined box defending, excellent pressing, or simply opponents missing chances; the event data and video should determine which explanation is credible. Use rolling samples rather than declaring a team’s identity from one match. A three-game swing can be dominated by a penalty, a red card, or an unusually early goal that changes behaviour. Comparing several matches, the quality of opponents, and home-versus-away context reduces the risk of turning noise into a story. Player evaluation needs even more care. Goals minus xG can flag a finishing run, but it is not a permanent rating of finishing talent. A player scoring 12 goals from 7. 5 xG may be finishing above the model’s average expectation, benefiting from excellent technique, shot placement, goalkeeper errors, or random variation. A longer sample is needed before attributing the gap to a repeatable skill. xG per shot helps distinguish shot selection from shot volume. A forward with 0.20 xG per attempt may be finding central, well-created chances, while another with 0. 06 may shoot frequently from poor locations. Total xG still matters because a player has to get into shooting positions often enough, but the two measures answer different questions. Add minutes, touches in the box, shot assists, role, and team style before comparing players from different systems. Post-shot expected goals, sometimes called PSxG, evaluates the shot after it has been taken and can incorporate where the ball was directed. Standard xG asks how dangerous the opportunity was before the finish; PSxG asks how difficult the resulting shot was to save. That makes PSxG useful in goalkeeper analysis and in separating chance creation from shot execution, although definitions differ by provider. xG does not know everything that a coach, scout, or viewer can see. A model may lack complete information about a striker’s balance, the precise pressure applied a fraction of a second before the shot, an injury, weather, fatigue, or a defender’s communication. Even when those variables are available, a model simplifies them. The output is therefore an estimate, not a forensic verdict. Model outputs also cannot be compared casually across providers. Different training competitions, tagging rules, feature sets, treatment of blocked shots, and penalty conventions produce different values. A 0. 30 from one model is not automatically equivalent to 0.30 from another. For reliable monitoring, keep the provider and definitions consistent, and use calibration or historical back-testing where possible. Finally, xG is not a complete match-probability model. A side with higher xG did not necessarily “deserve” to win every time, because chance quality is only one part of the result and goals remain discrete events. As Opta notes in its explainer, the expected value should be understood over many comparable attempts rather than as a promise about a single game. Expected goals turns the vague question “How good was that chance?” into a repeatable probability estimate. It rewards careful attention to location, angle, technique, defensive context, and the action that created the shot. Its greatest value is not predicting one finish with certainty. It is helping analysts see patterns across many attempts: which teams create valuable chances, which players choose good shooting opportunities, and where results may be running ahead of performance. The strongest xG analysis combines a transparent model, a sufficiently large sample, and football expertise. Treat the number as a disciplined starting point, test it against the match evidence, and remember that every model reflects the data and assumptions behind it. My name is Jeferson, a passionate football enthusiast and the creator of this portal dedicated to fans of the world’s most popular sport. My goal is to provide reliable information, up-to-date news, match analysis, transfer updates, tournament coverage, and everything happening both on and off the pitch.How to read xG for teams
How to read xG for players
What xG cannot tell you
A practical workflow for using xG responsibly
Conclusion
Sources and further reading